
Model simulations were made from 2016 to 2018 to overlap with the SLOMO observations. The model was forced with the ERA-5 atmospheric product and the HYCOM model as boundary conditions.
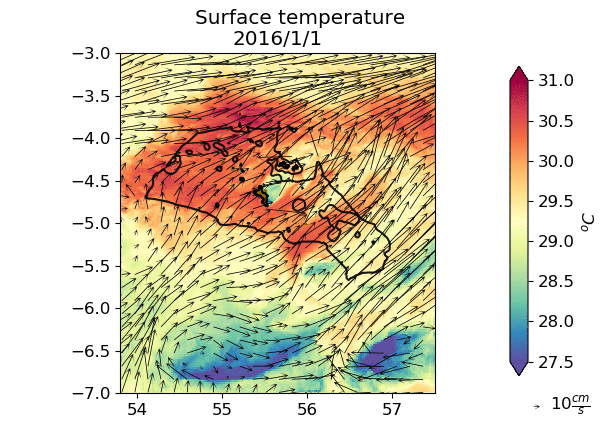
Sea surface temperature (color) with sea surface velocity vectors arrows) over the full model domain January to March 2016. The black solid line denotes the 100 m isobath (Seychelles Plateau).
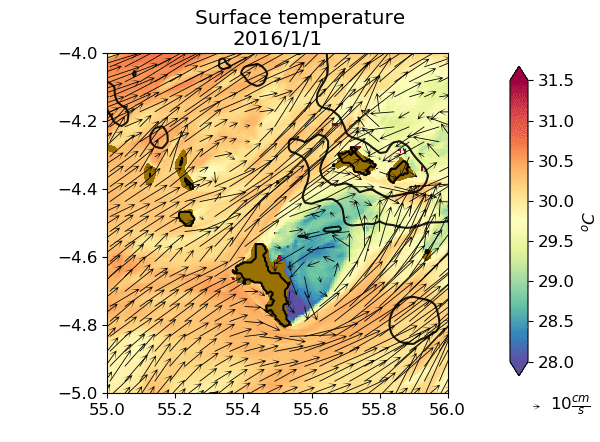
Sea surface temperature (color) with sea surface velocity vectors (arrows) over a subset region atop the Seychelles Plateau encompassing the Islands of Mahé, Praslin and La Digue from January to March 2016. Note the wake east and west of Mahé.
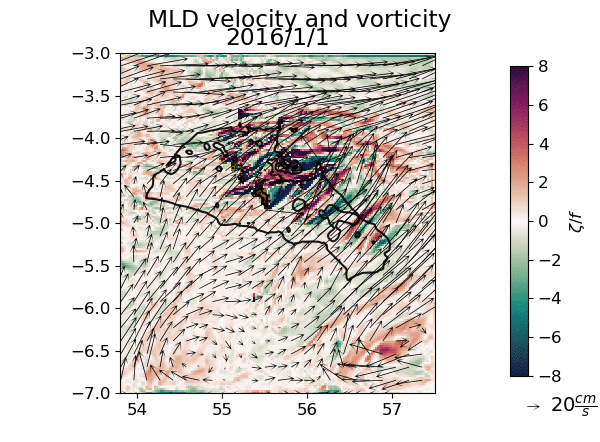
Vorticity (color) and velocity vectors (arrows) averaged over the MLD over the model domain for January 2016.
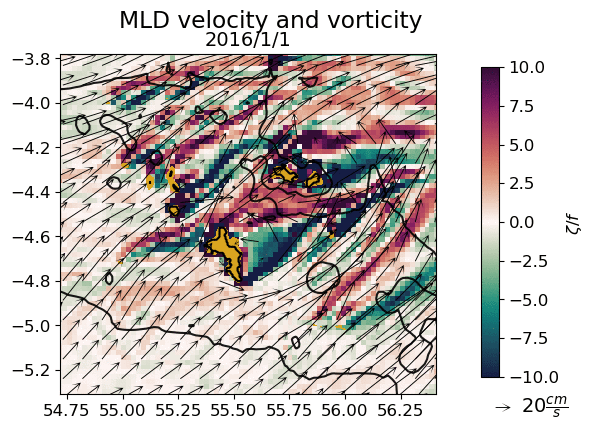
MLD-averaged vorticity (color) with sea surface velocity vectors (arrows) over a subset region atop the Seychelles Plateau encompassing the Islands of Mahé, Praslin and La Digue from January 2016. Note the high vorticity values close to the islands.